Golfgeek is a platform that provides elite golfers with in-depth statistics to improve their game and track their performance using shot data.

Golf is a true game of inches, and for elite level golfers data is at the core of this.
With the emergence of the strokes gained statistic, golfers now have a tangible way to track their performance and improve their game. Although other performance tracking platforms exist in the market, many of them feature outdated user interface design and lackluster user experience.

Connecting strokes to the tangible metrics that drive it
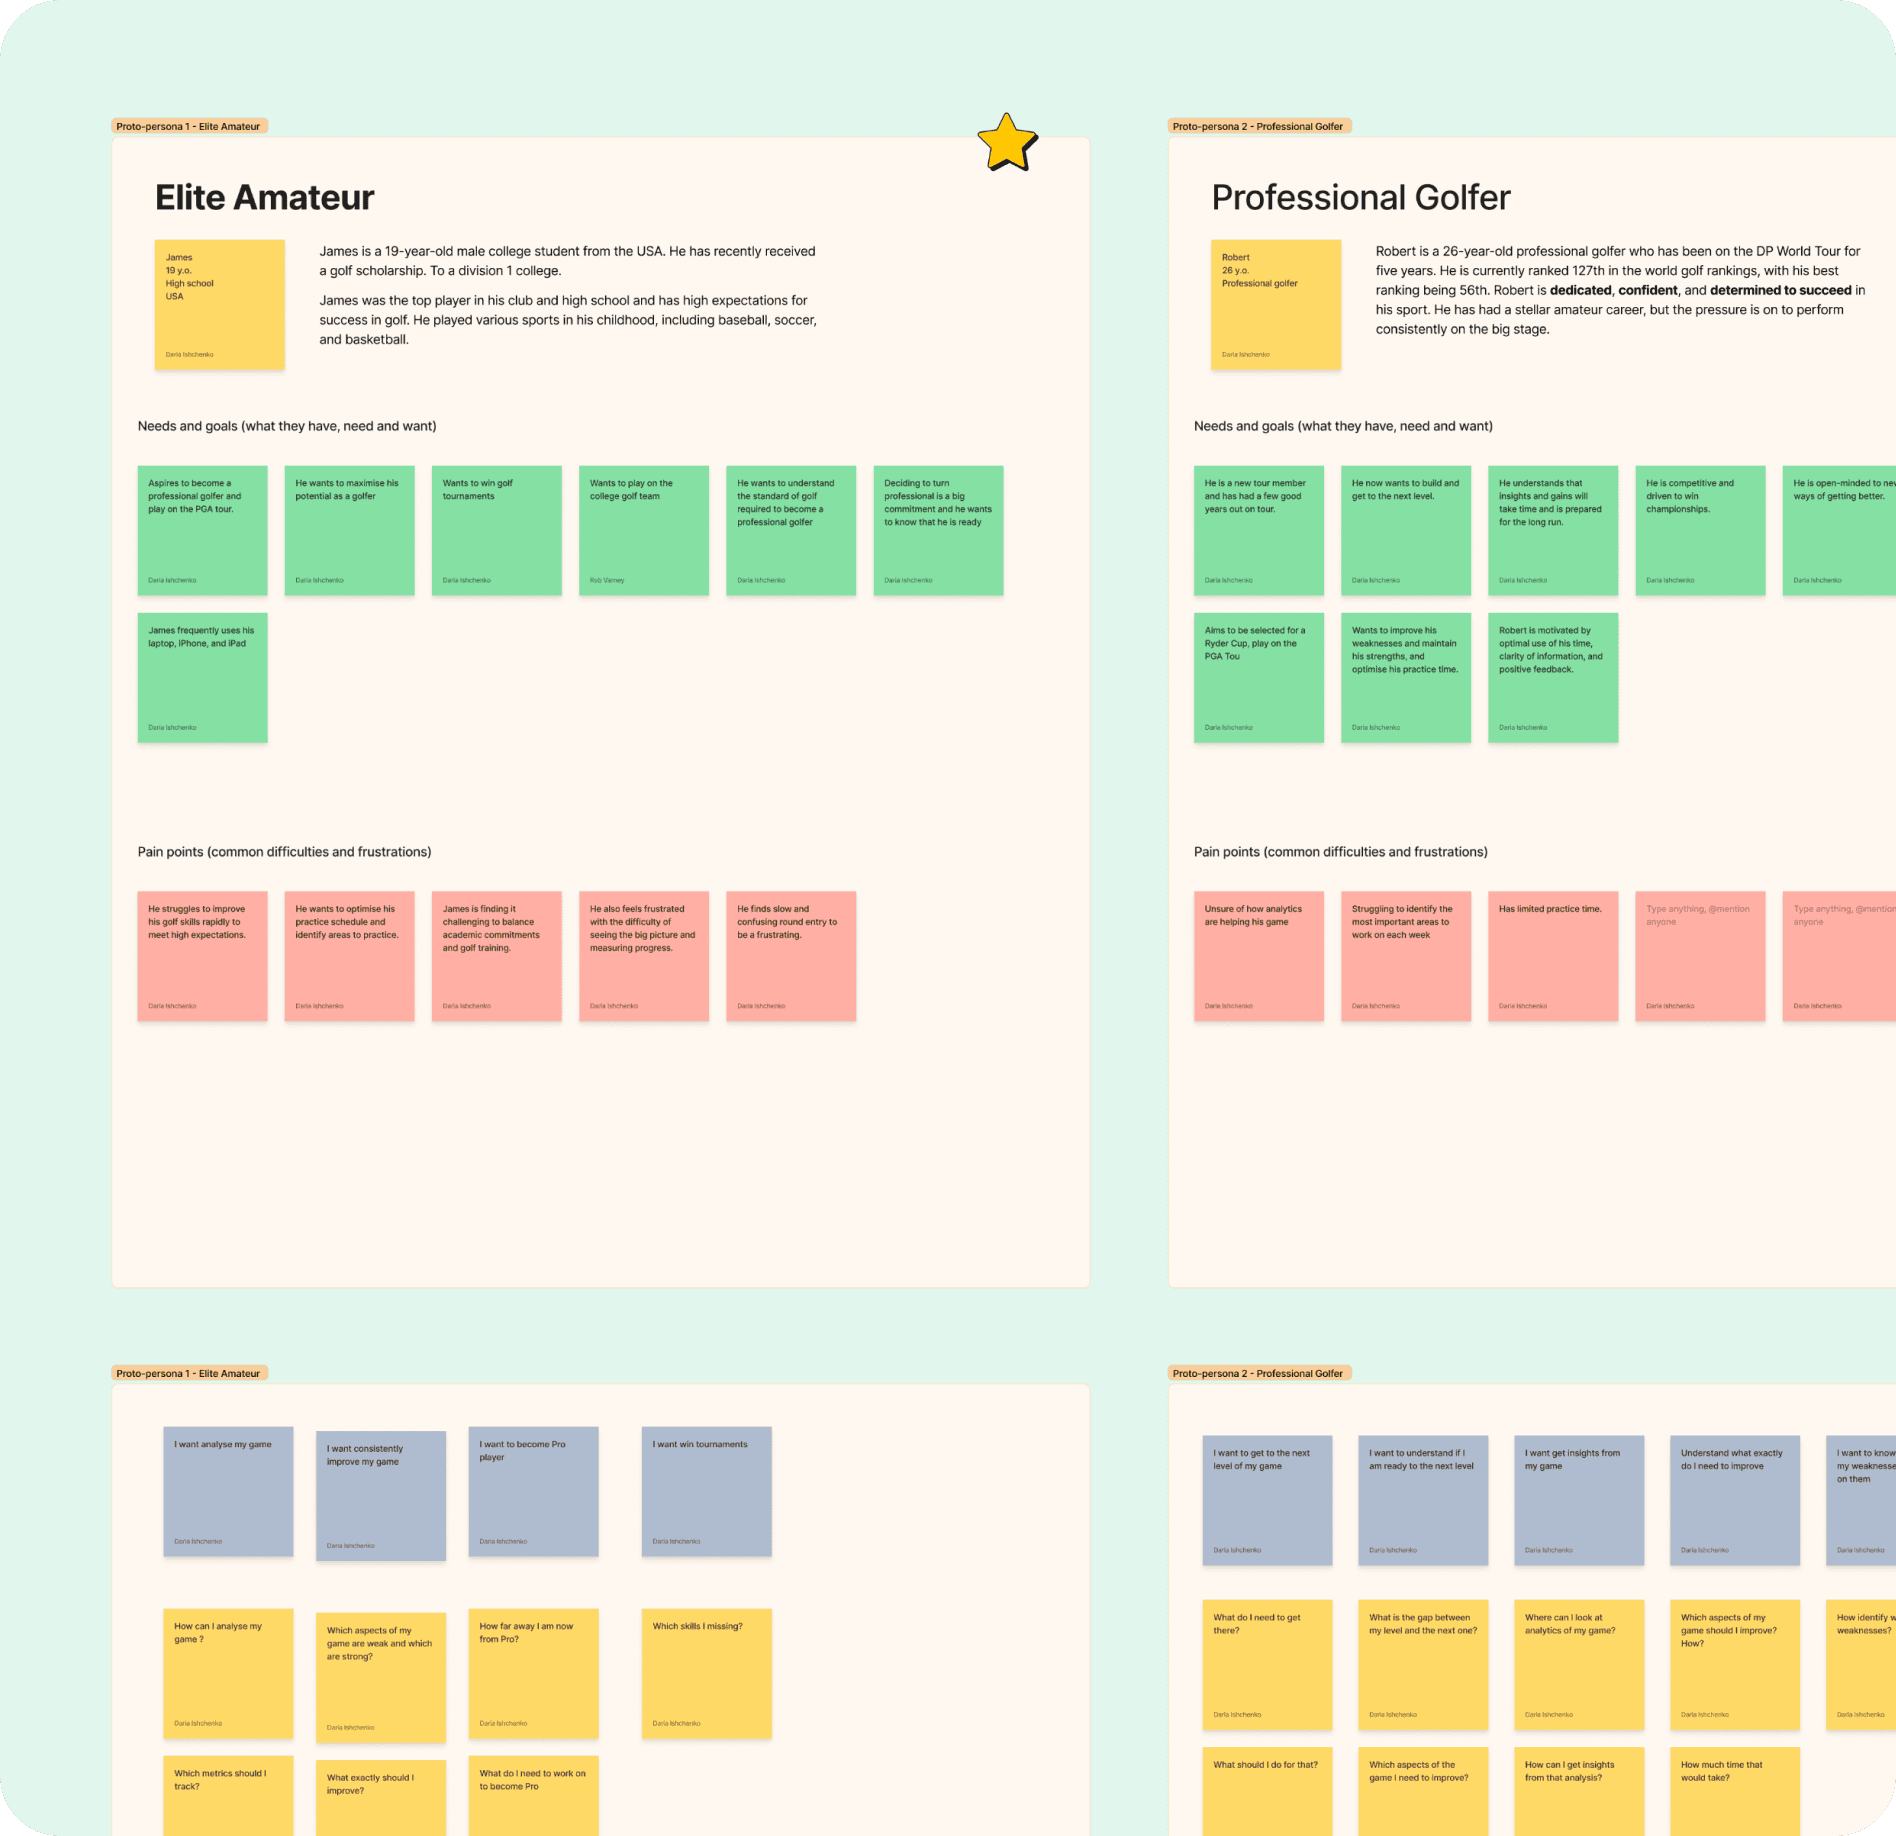
Analyzing Pain Points
Before designing the dashboard, we conducted extensive research to understand how golfers track and analyze their shots.
Structuring an Intuitive Dashboard
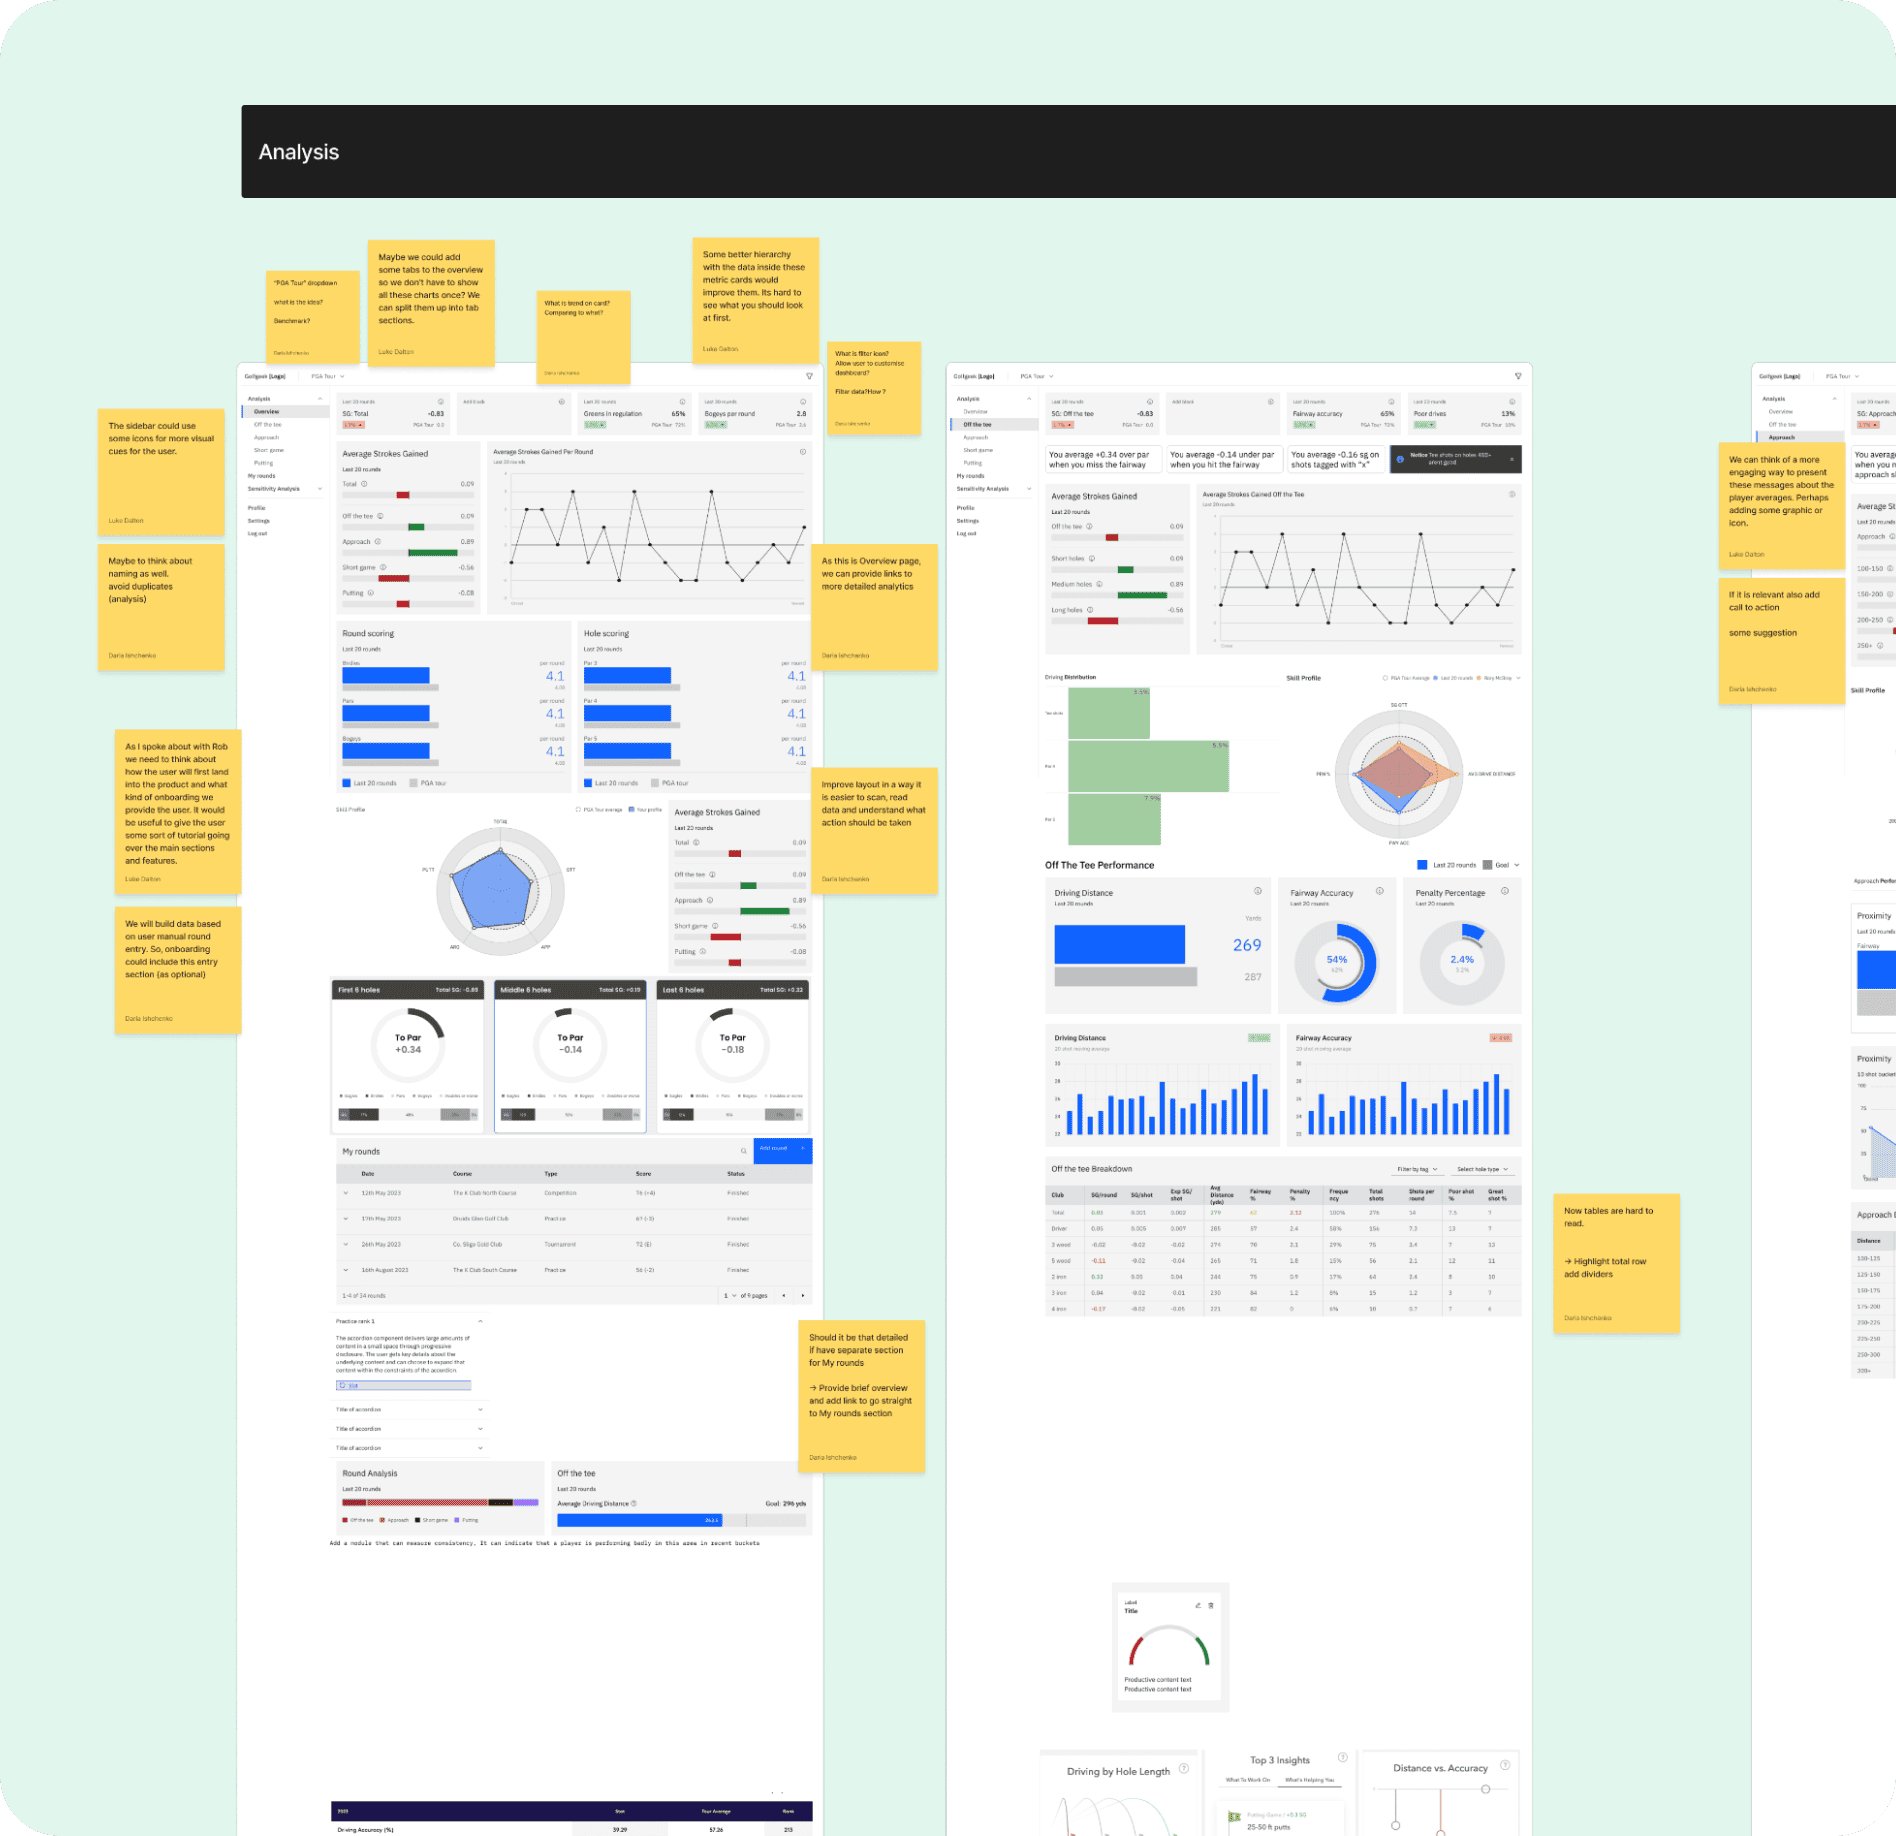
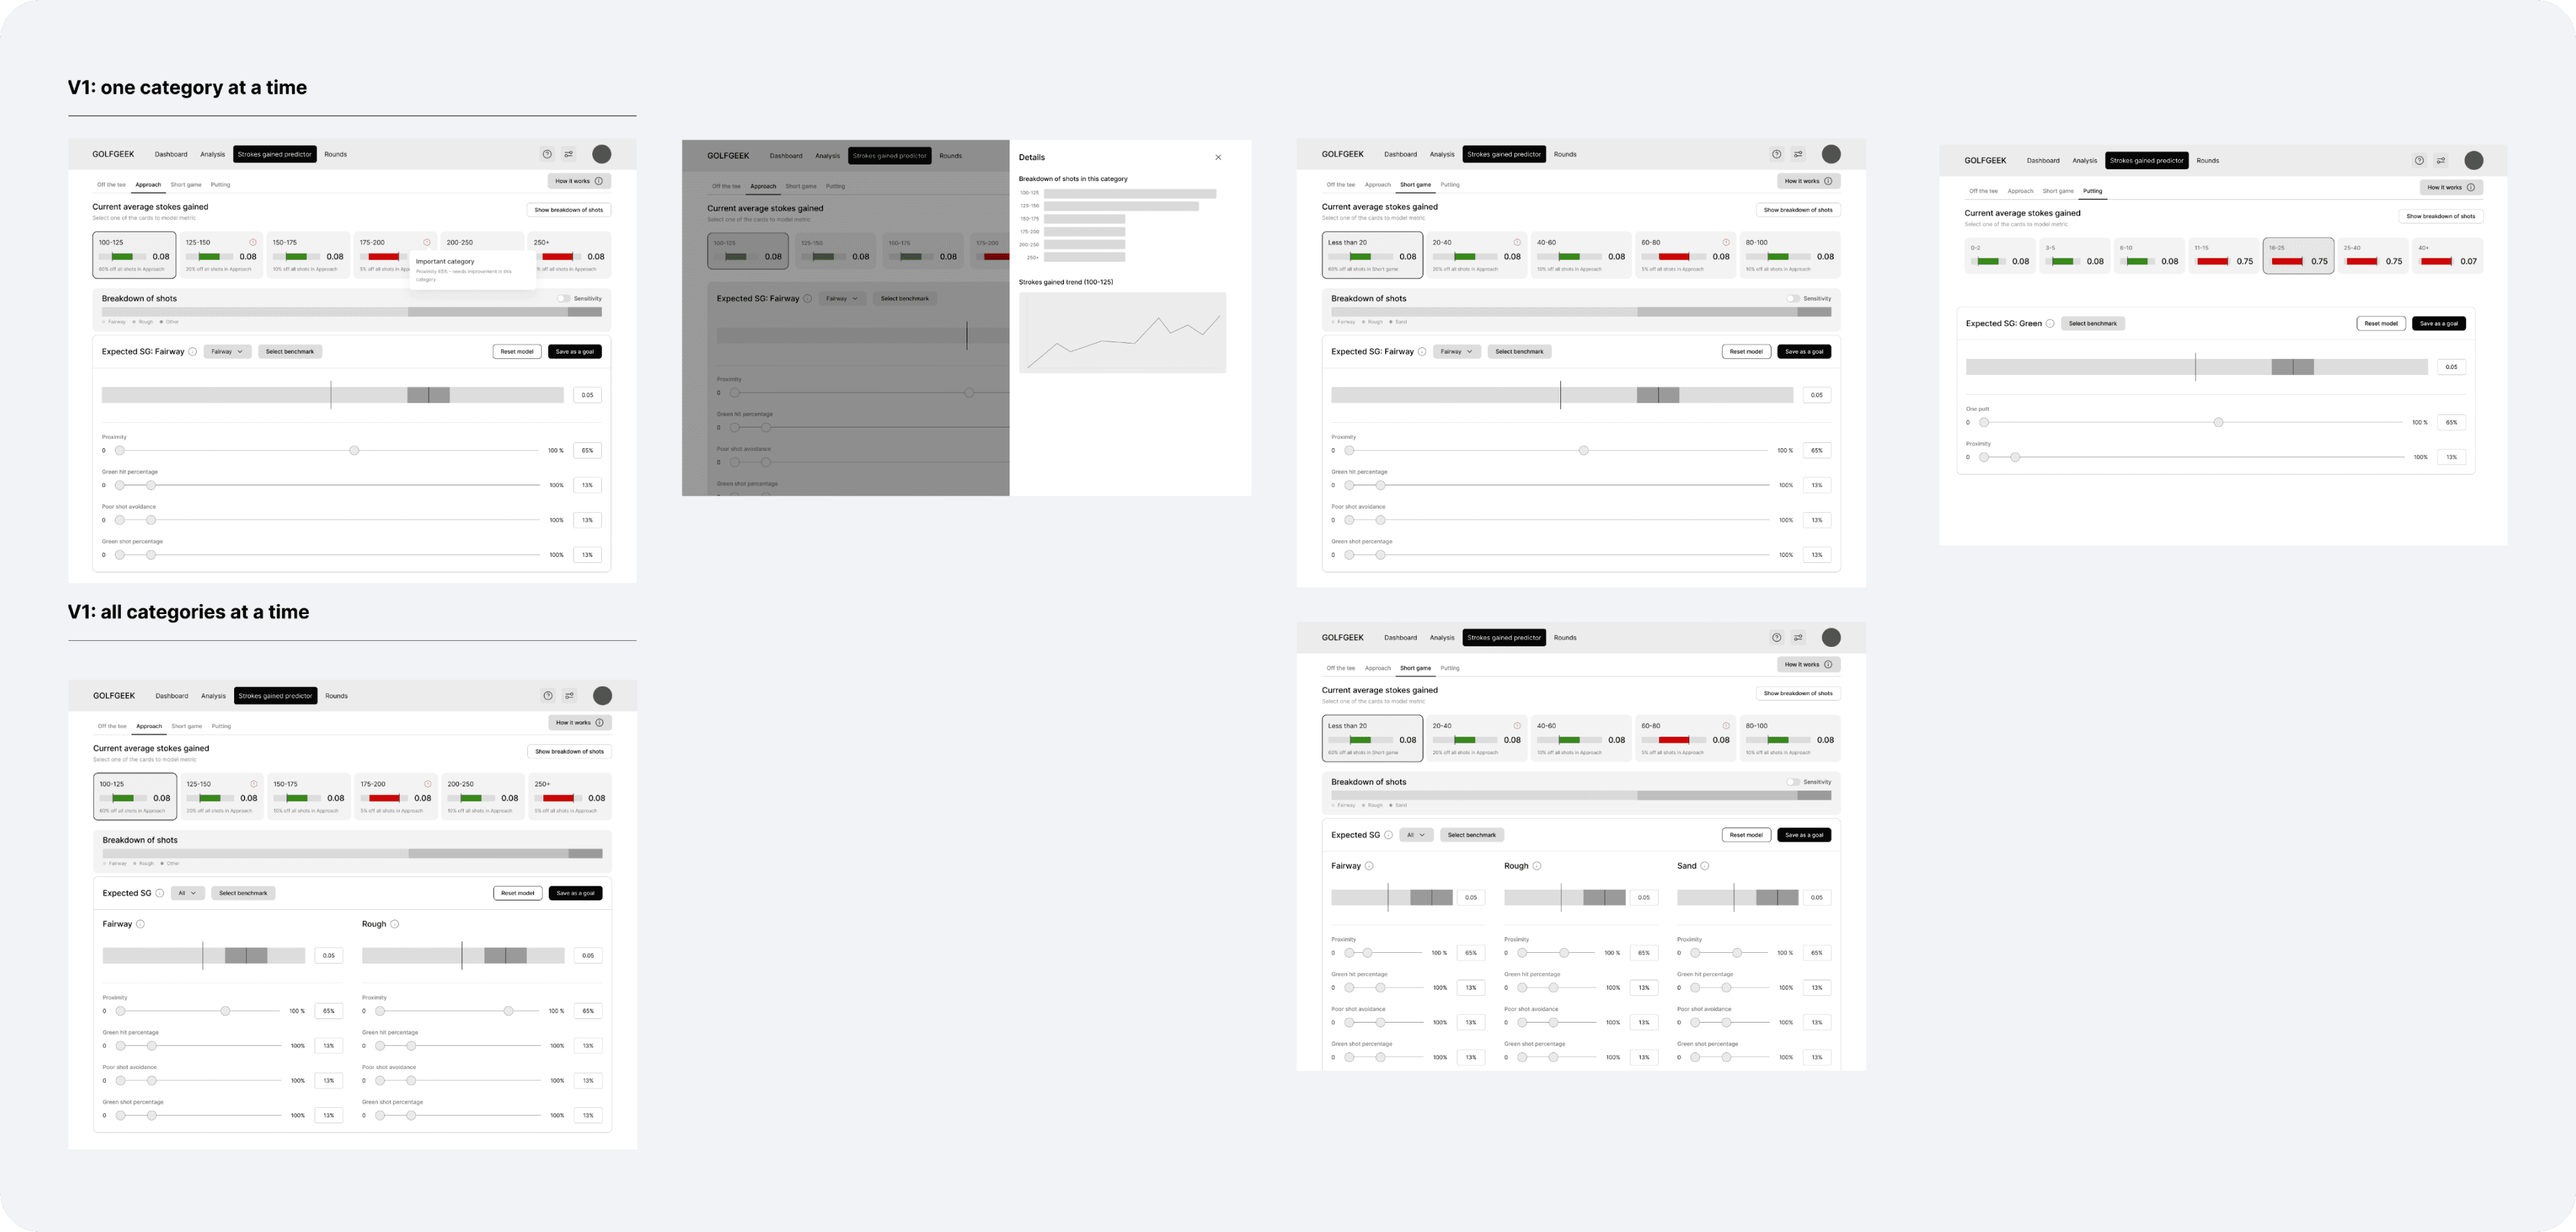
With research insights in place, we developed user flows and wireframes to map out an intuitive dashboard experience
Creating an Engaging & Data-Focused Interface
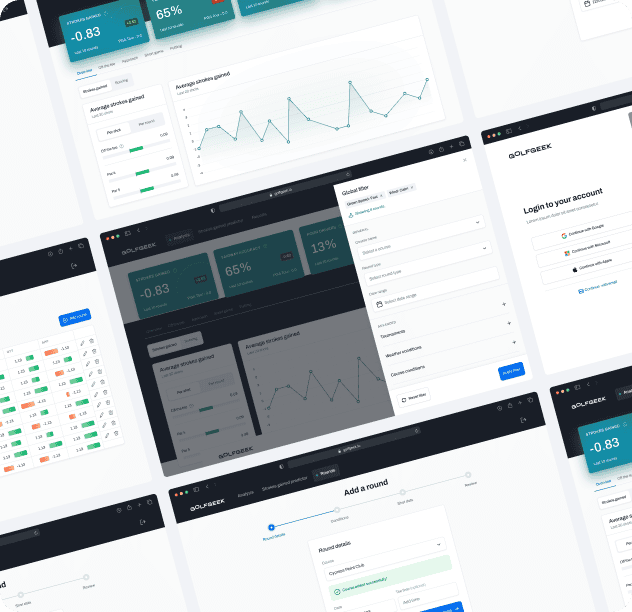
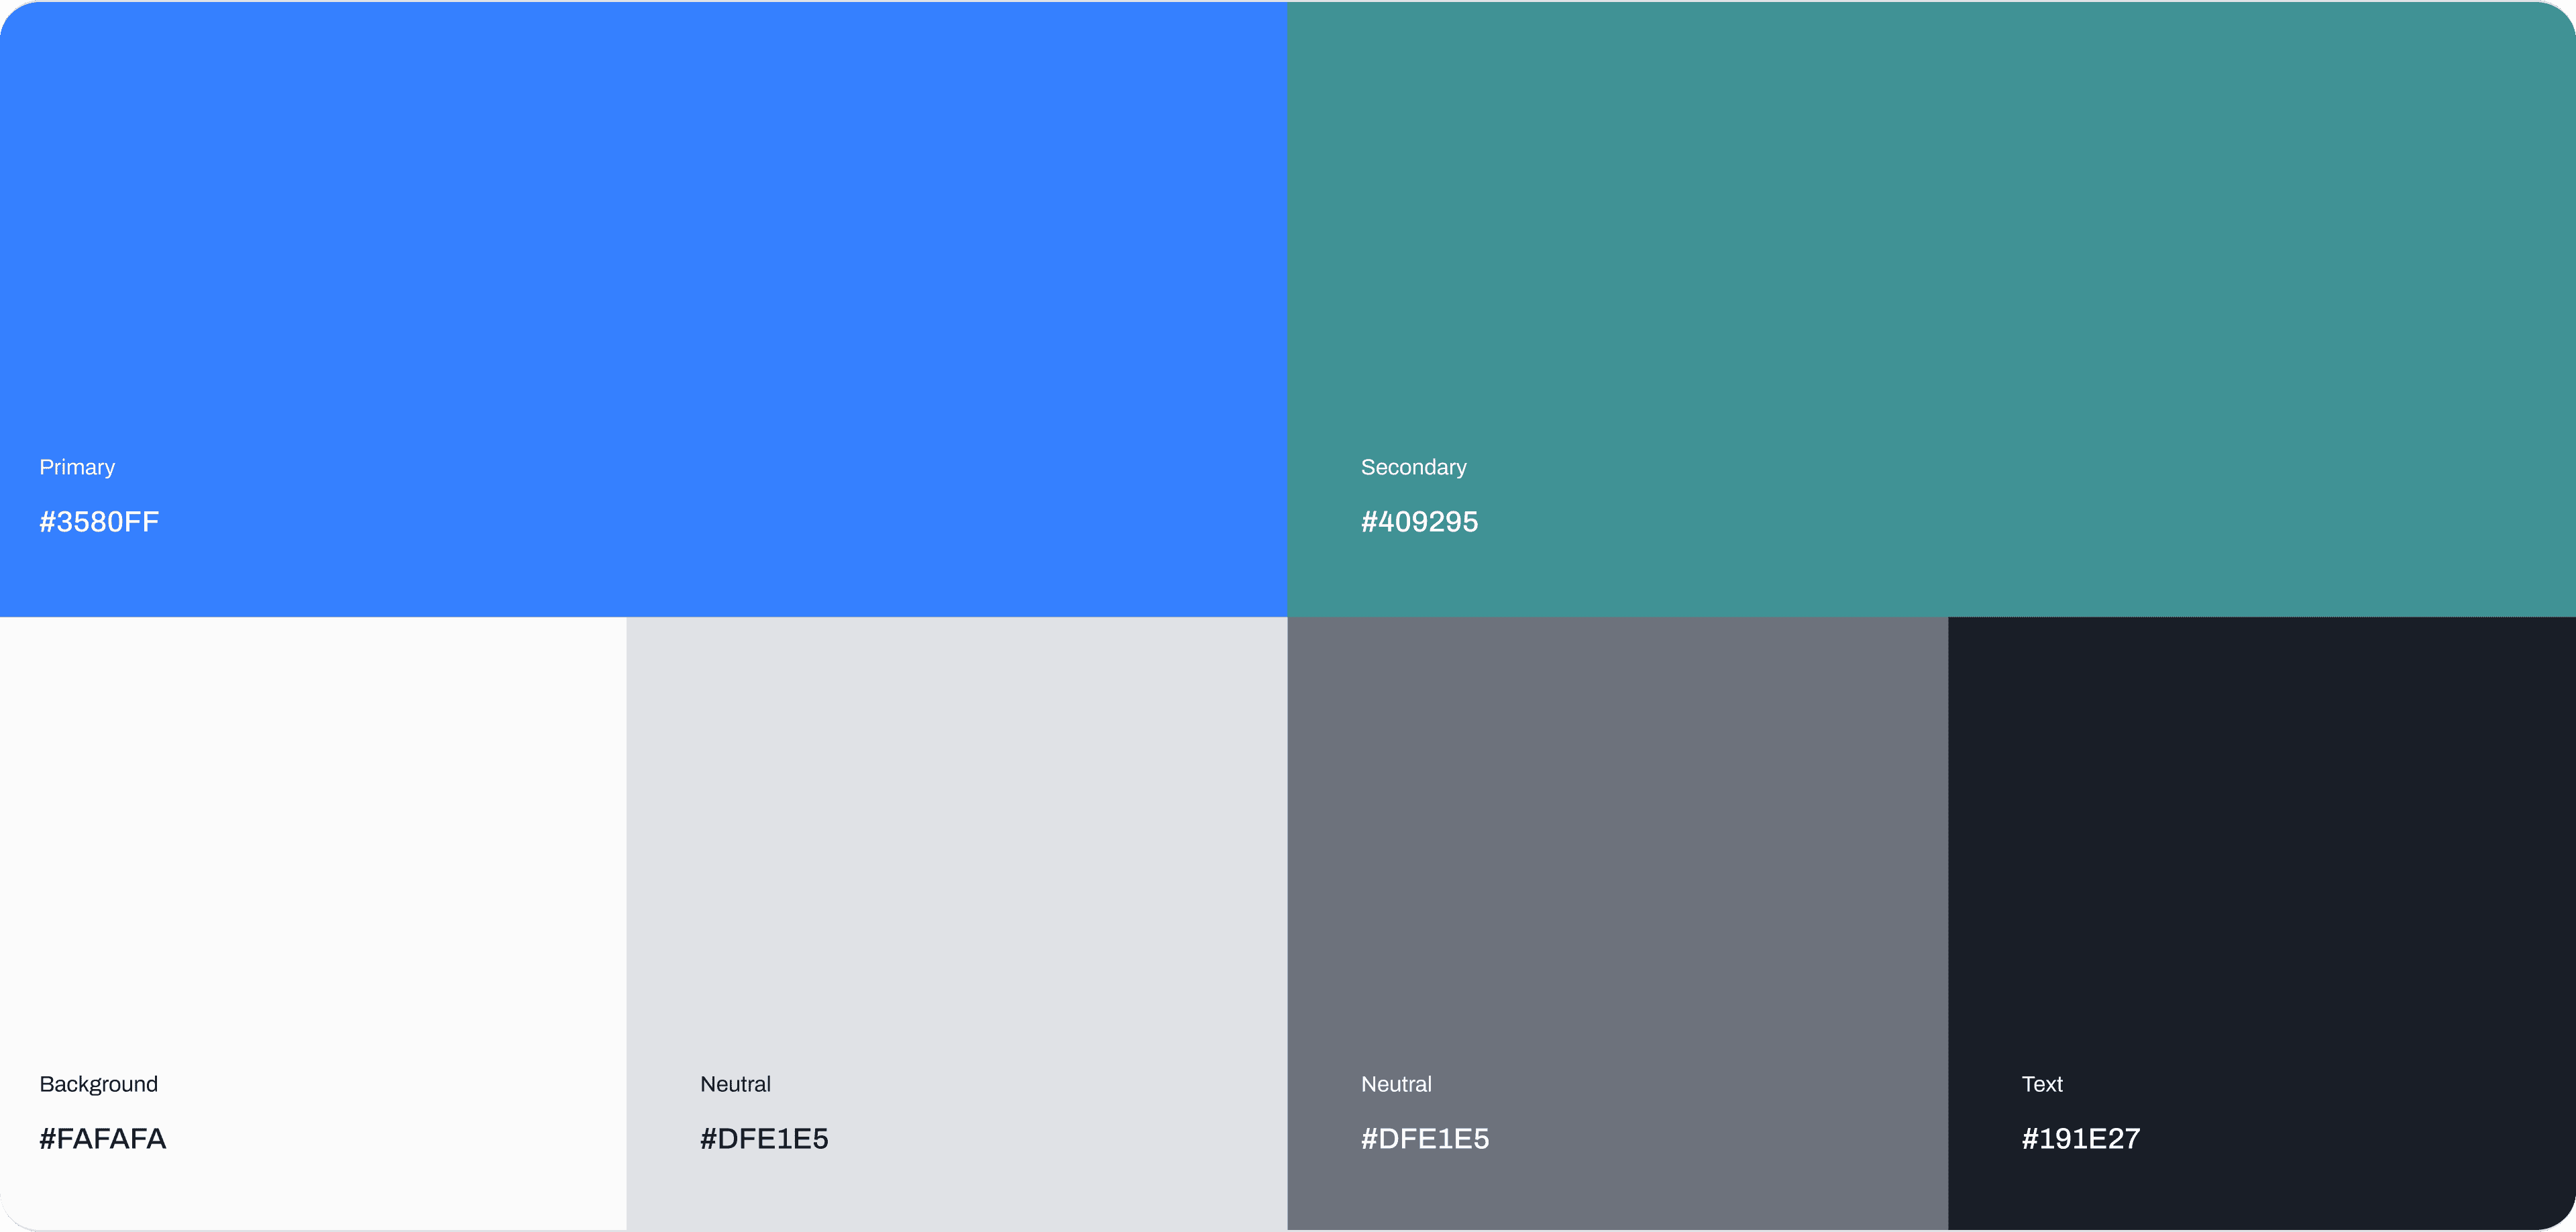
Once the dashboard structure was validated, we moved into high-fidelity UI design, ensuring the interface was both visually compelling and highly functional.
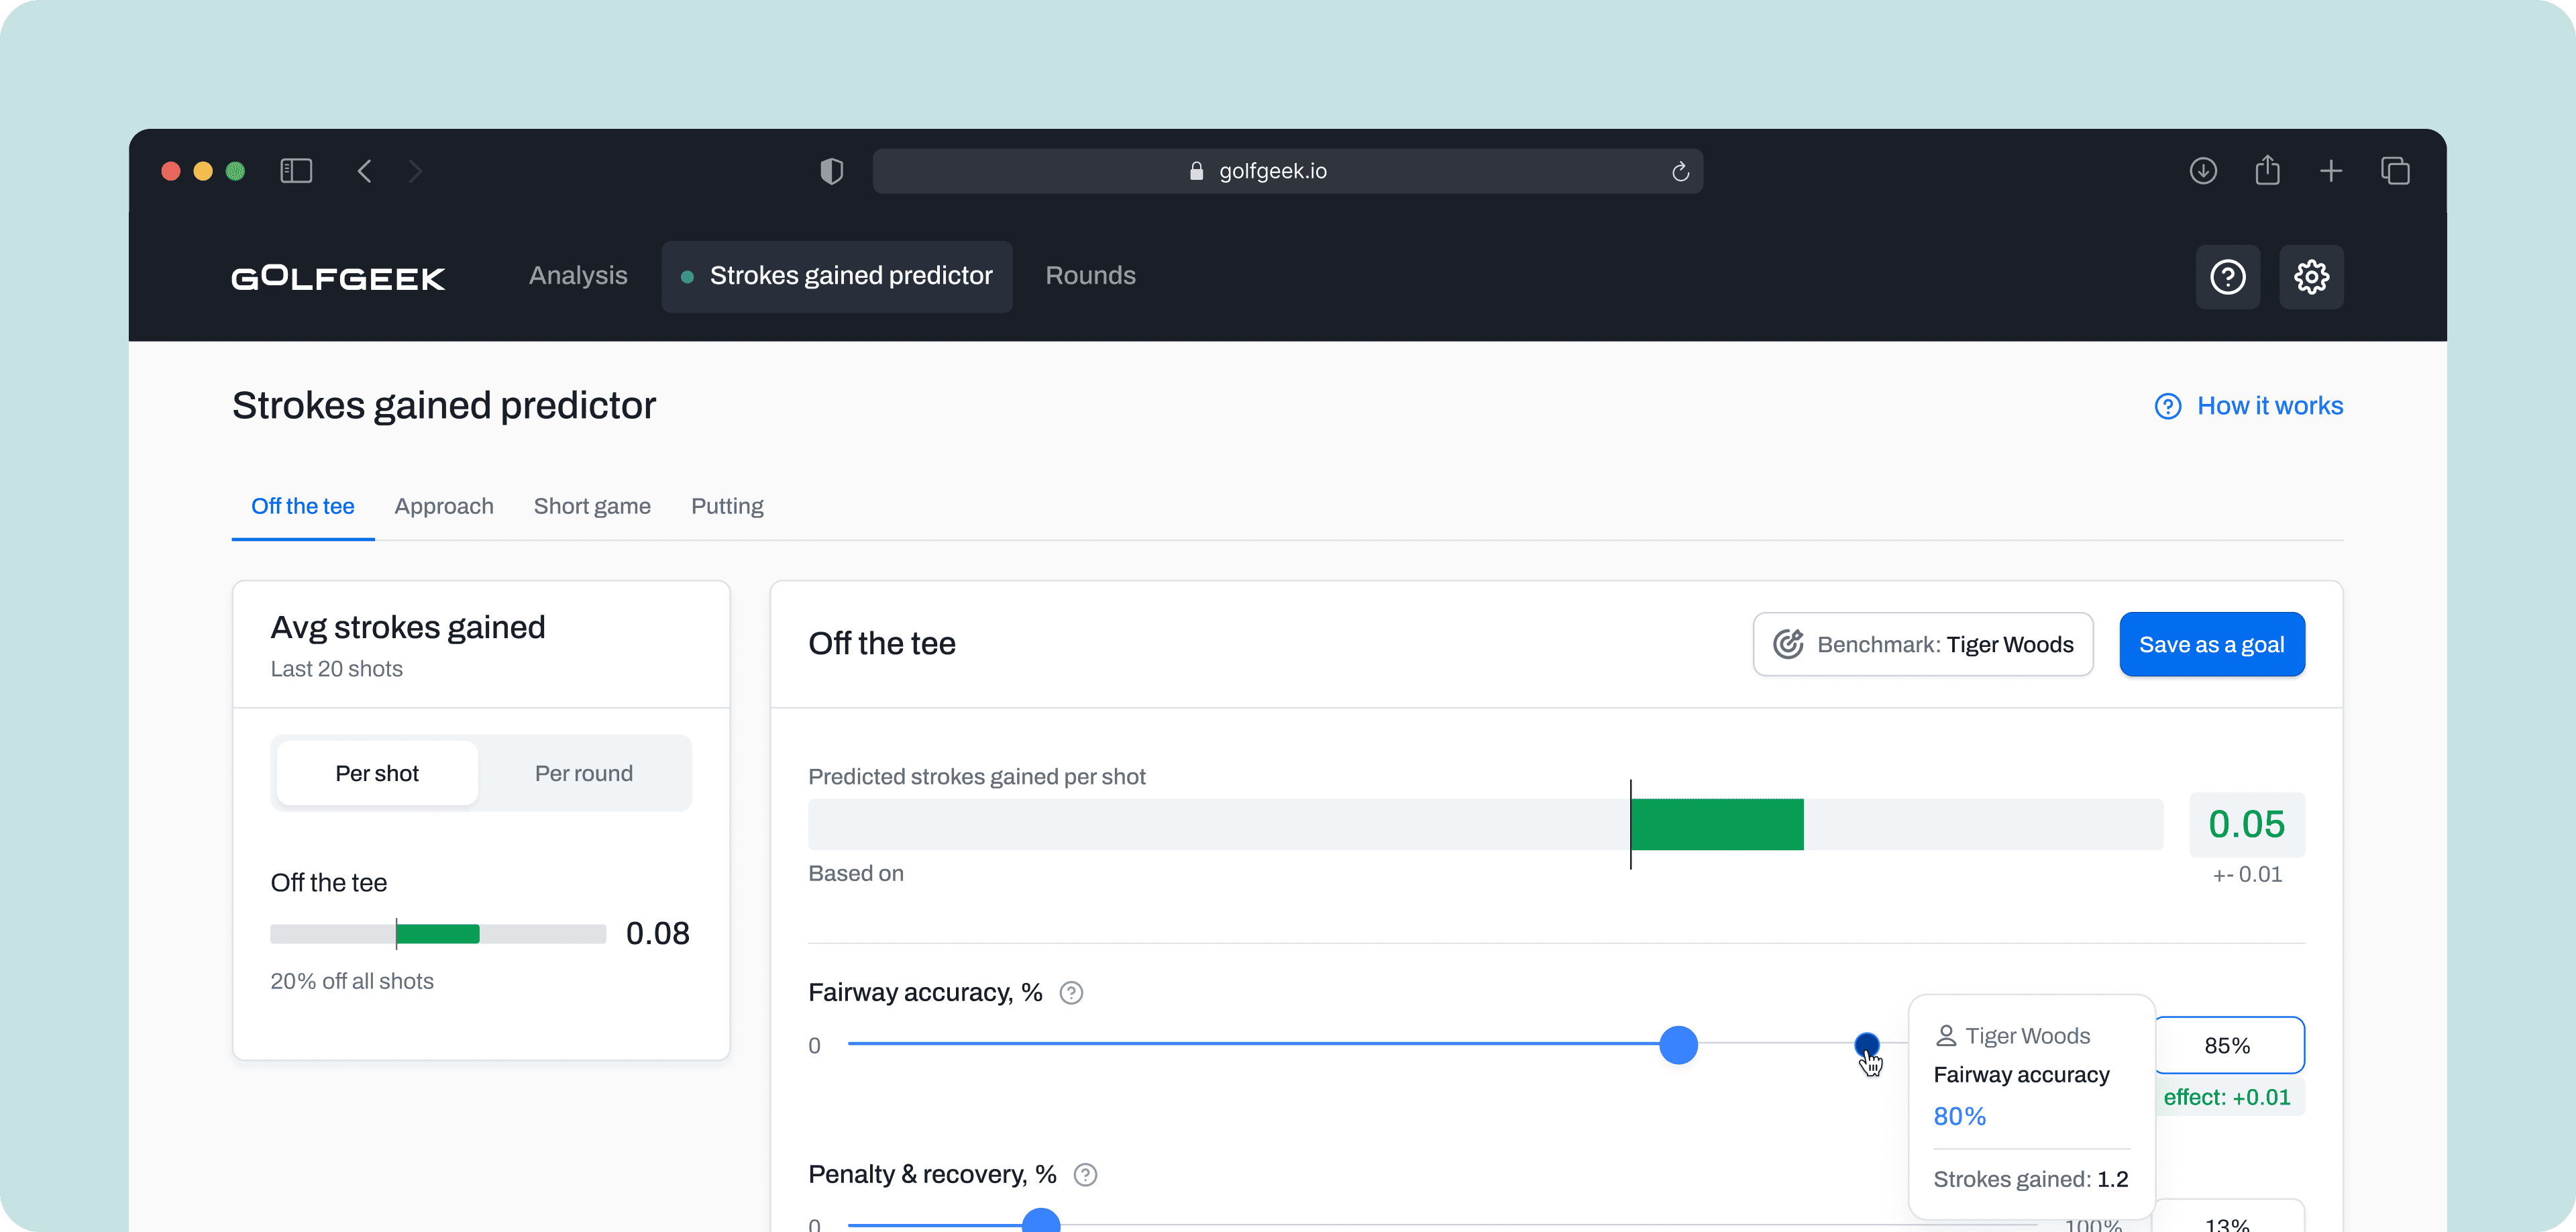
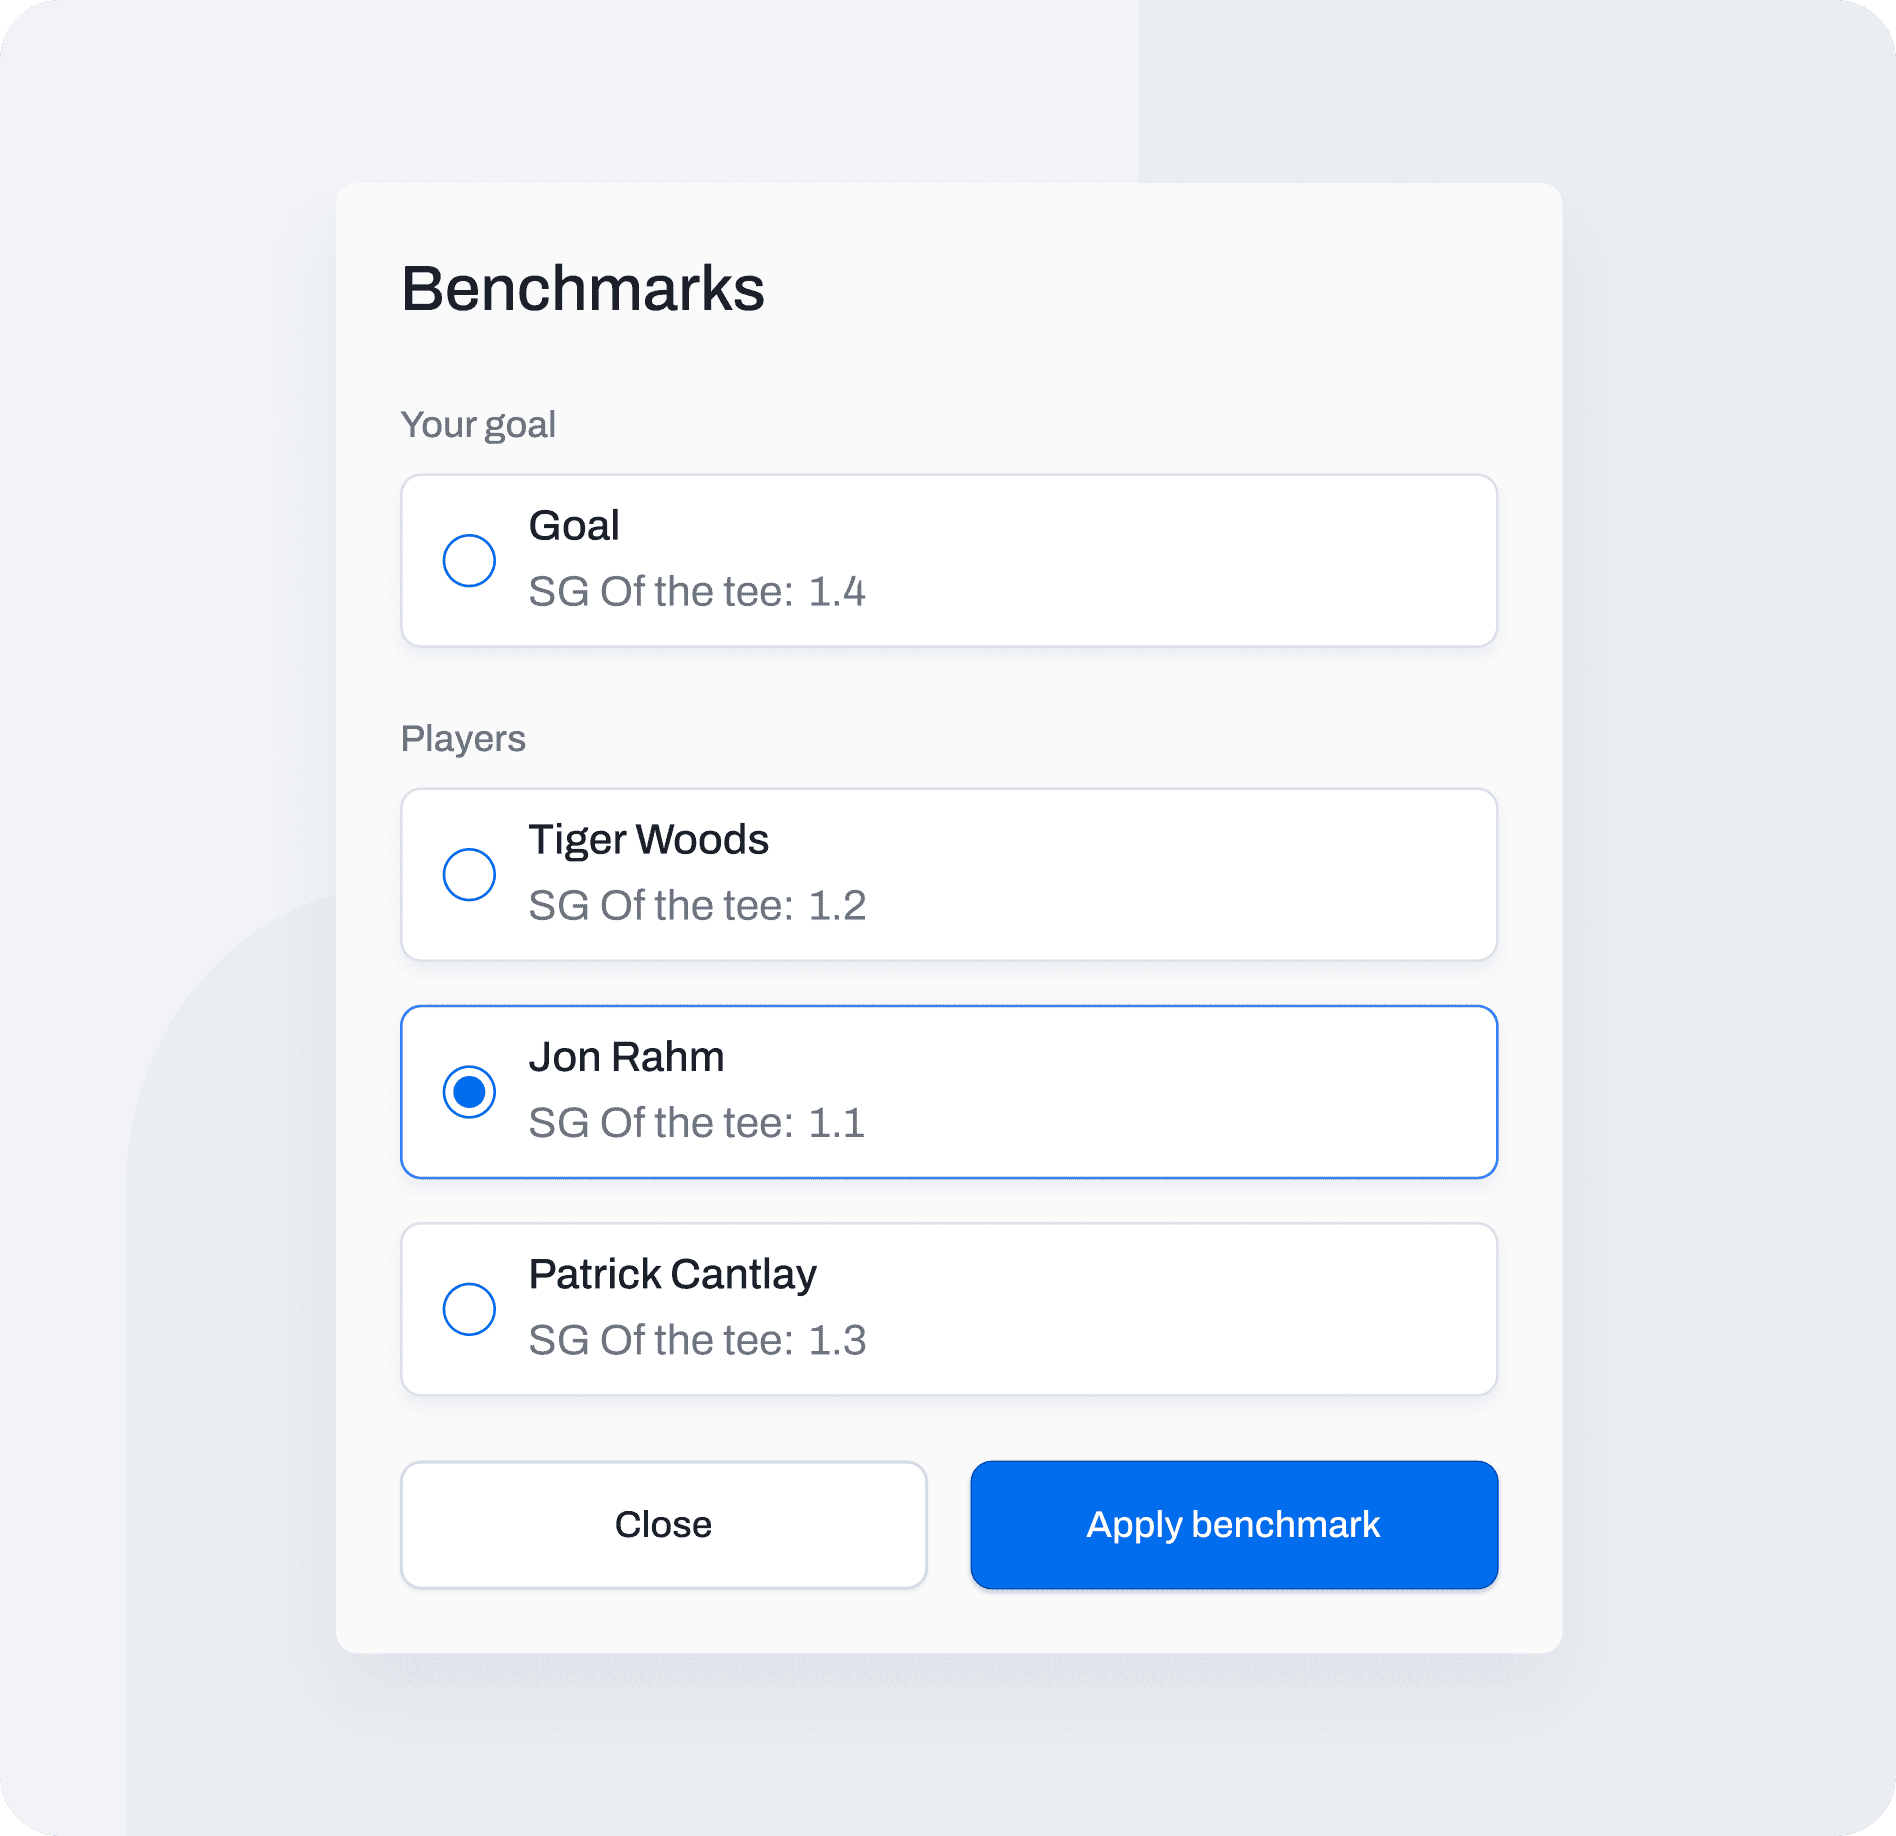
Compare, Set Goals, and Elevate Your Game
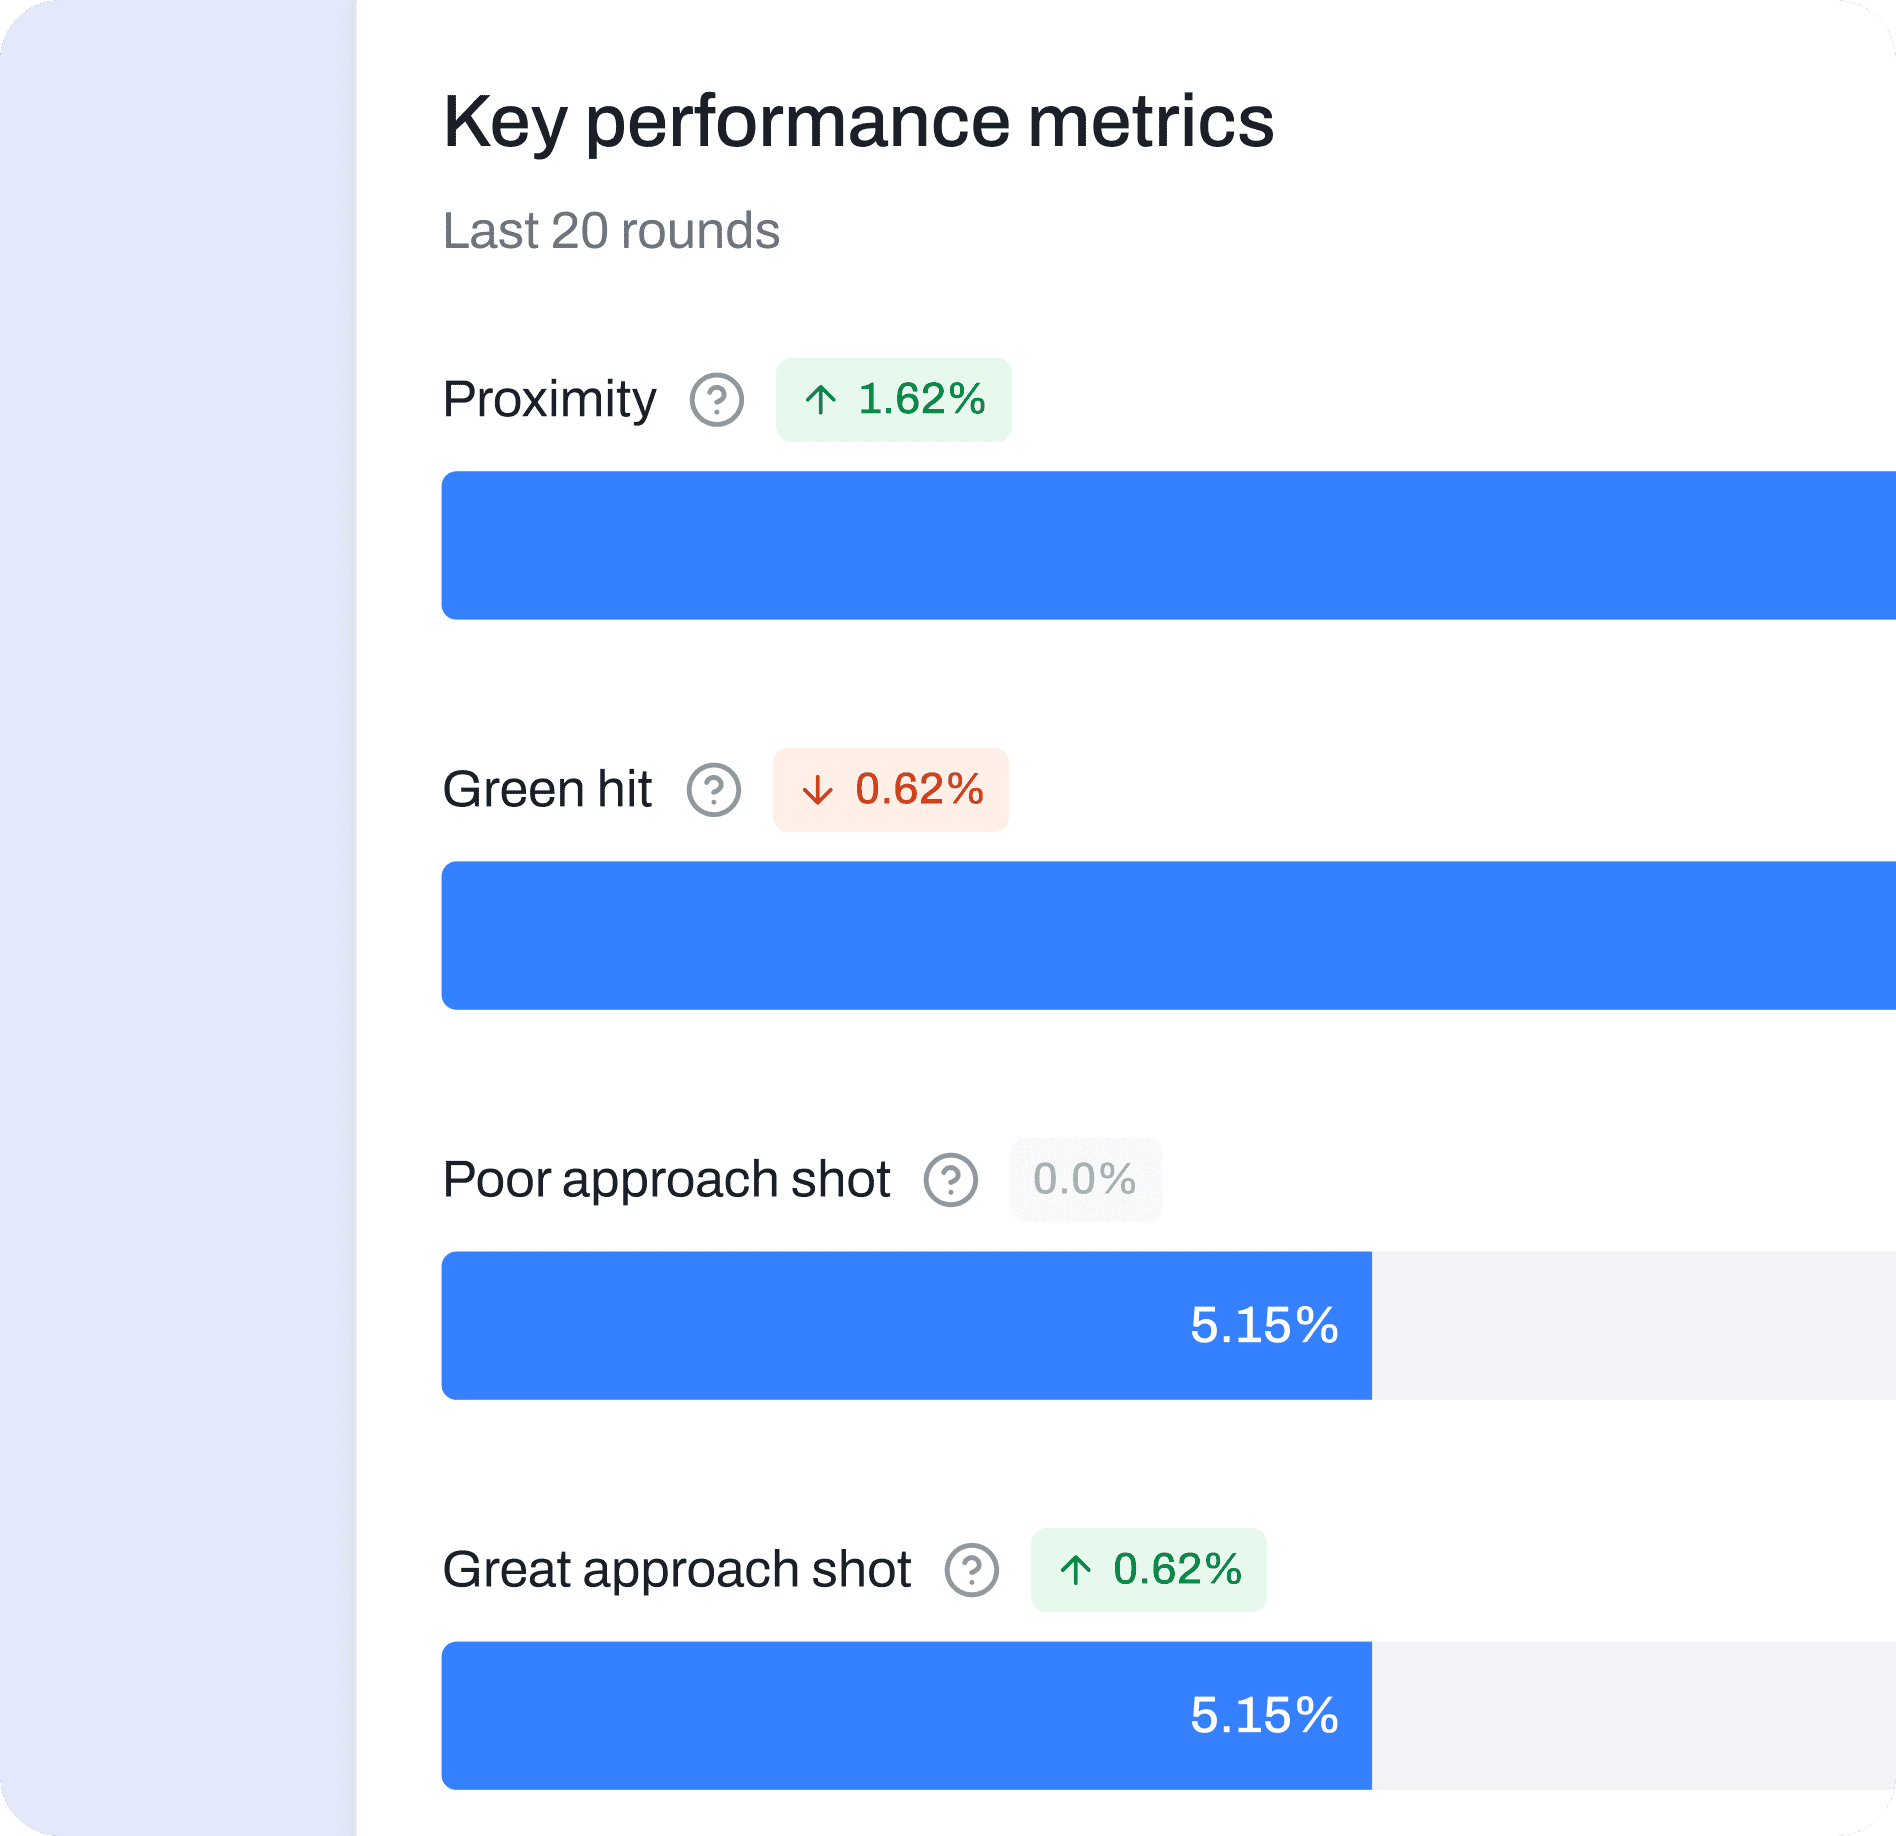
As part of our design process for GolfGeek, we created an intuitive benchmarking system that allows golfers to track their performance against other players.

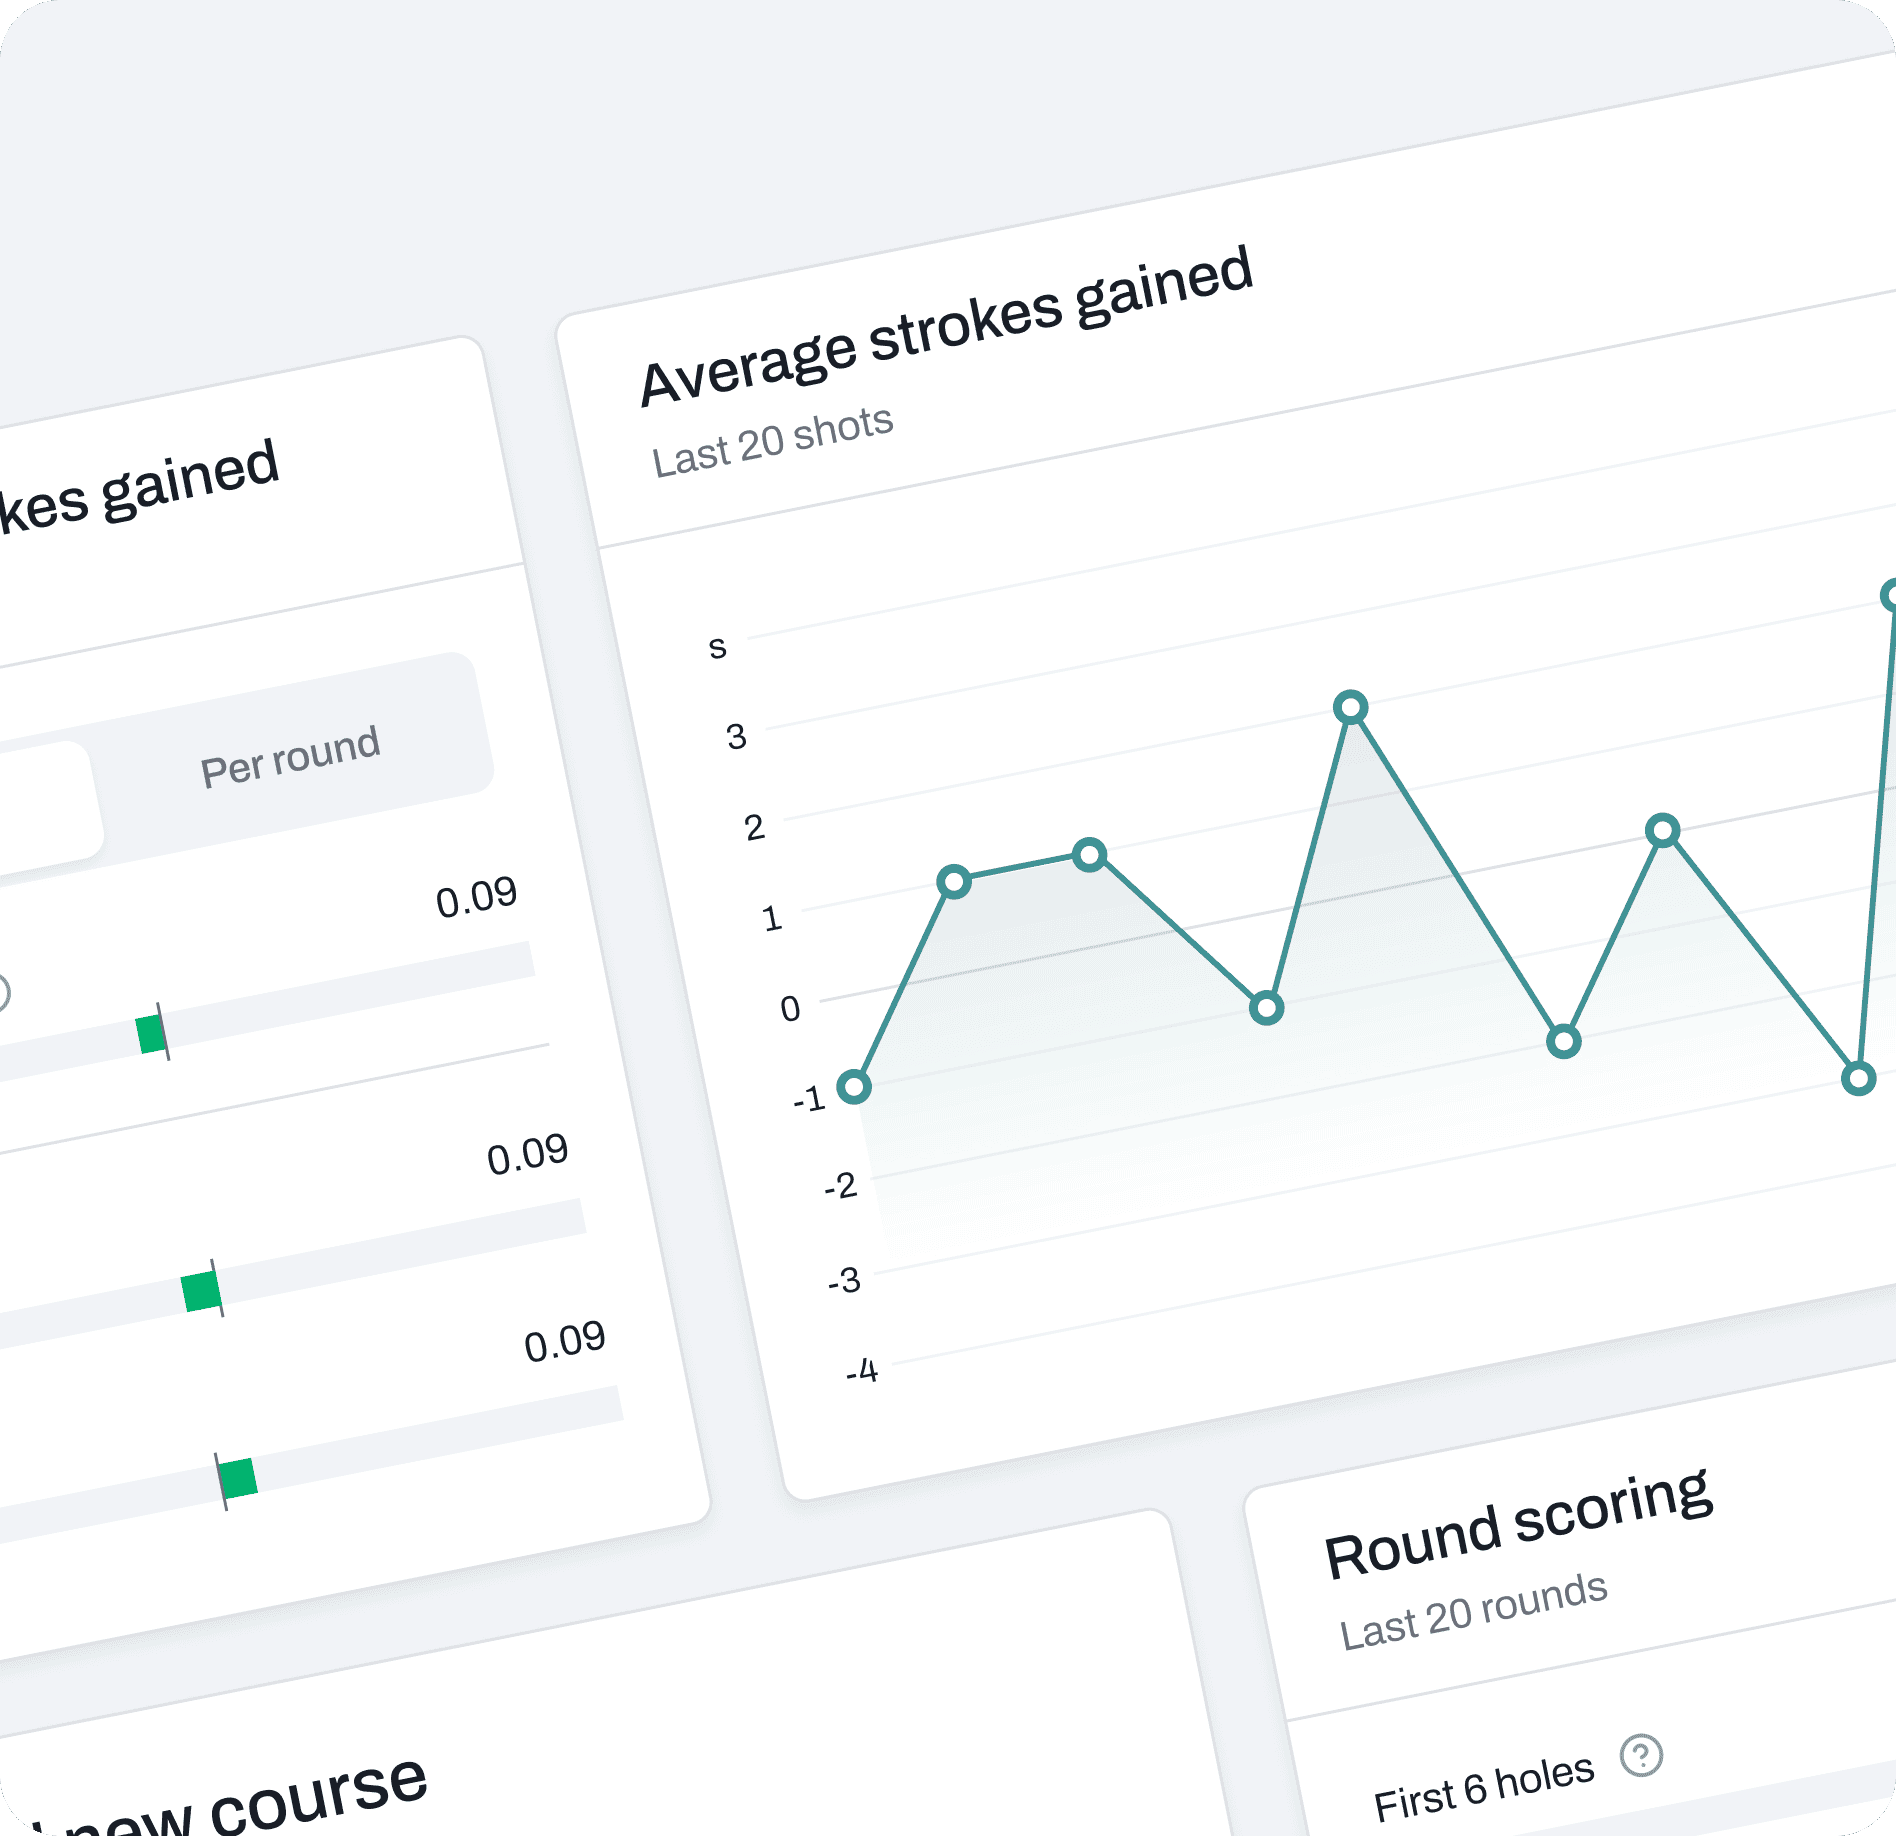
Track Progress, Analyze Trends, and Improve Your Game

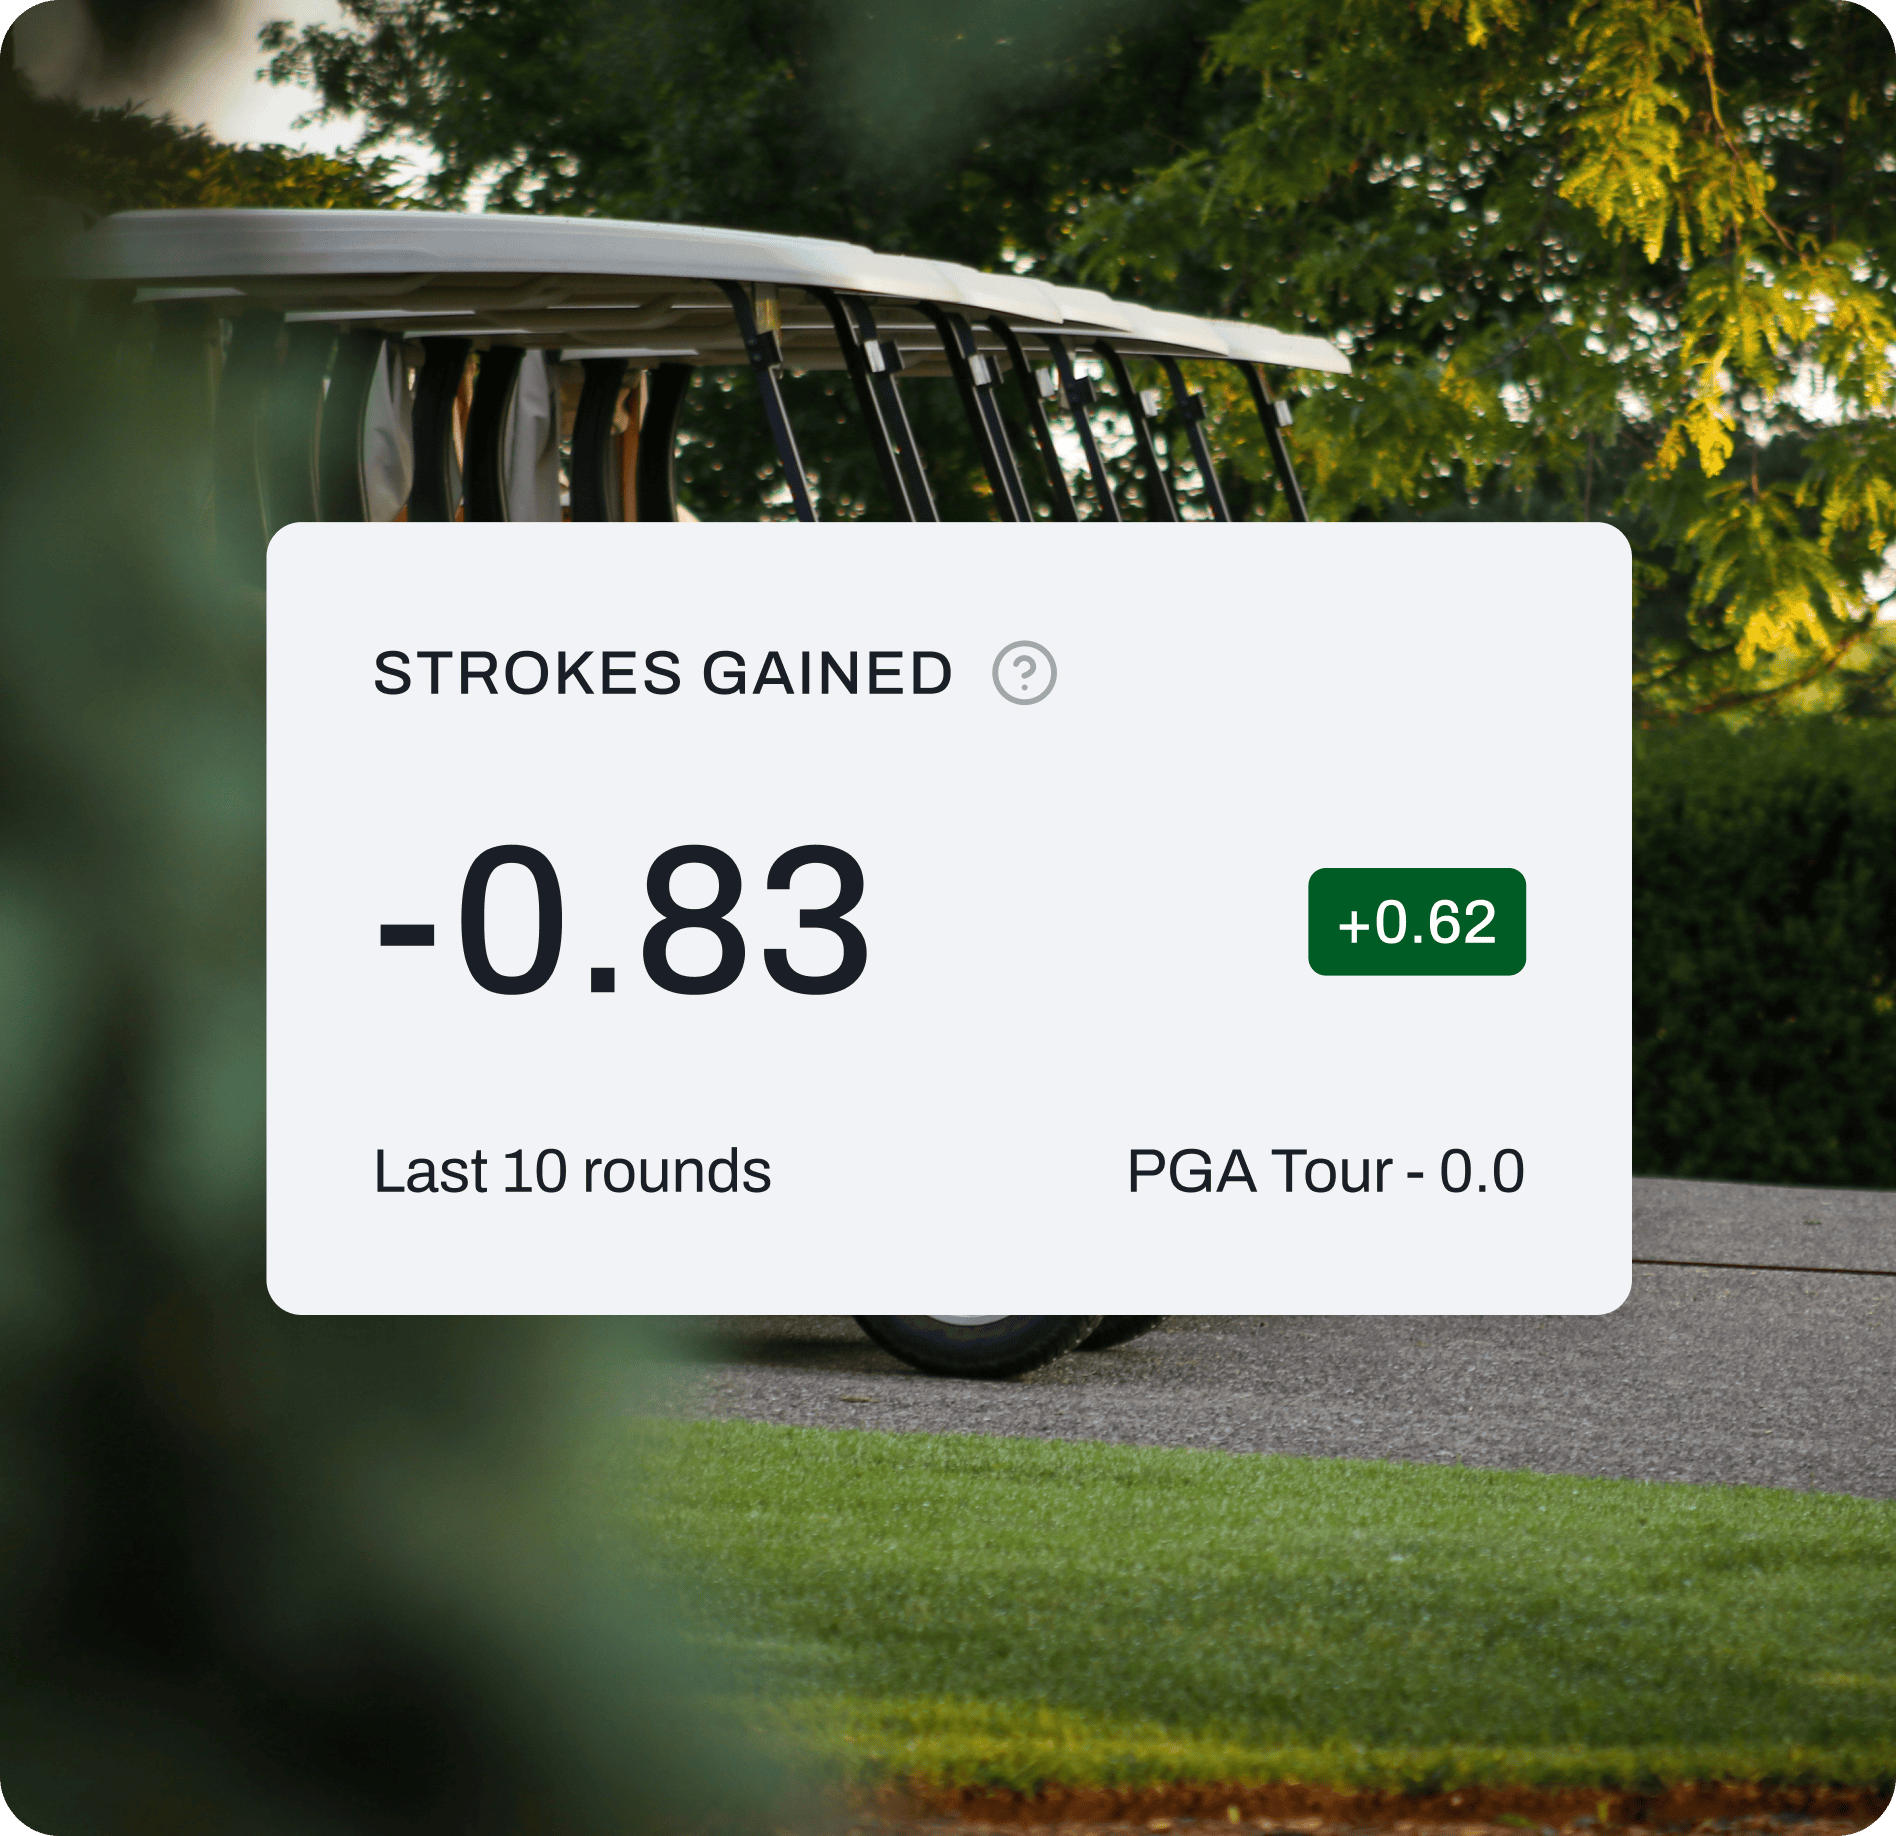

Bringing the Dashboard to Life
With the final UI design in place, we transitioned into the development phase, ensuring the dashboard was both functional and optimized for performance. Our focus was on creating a fast, responsive, and intuitive experience that allowed golfers to track their performance in real-time without any friction.

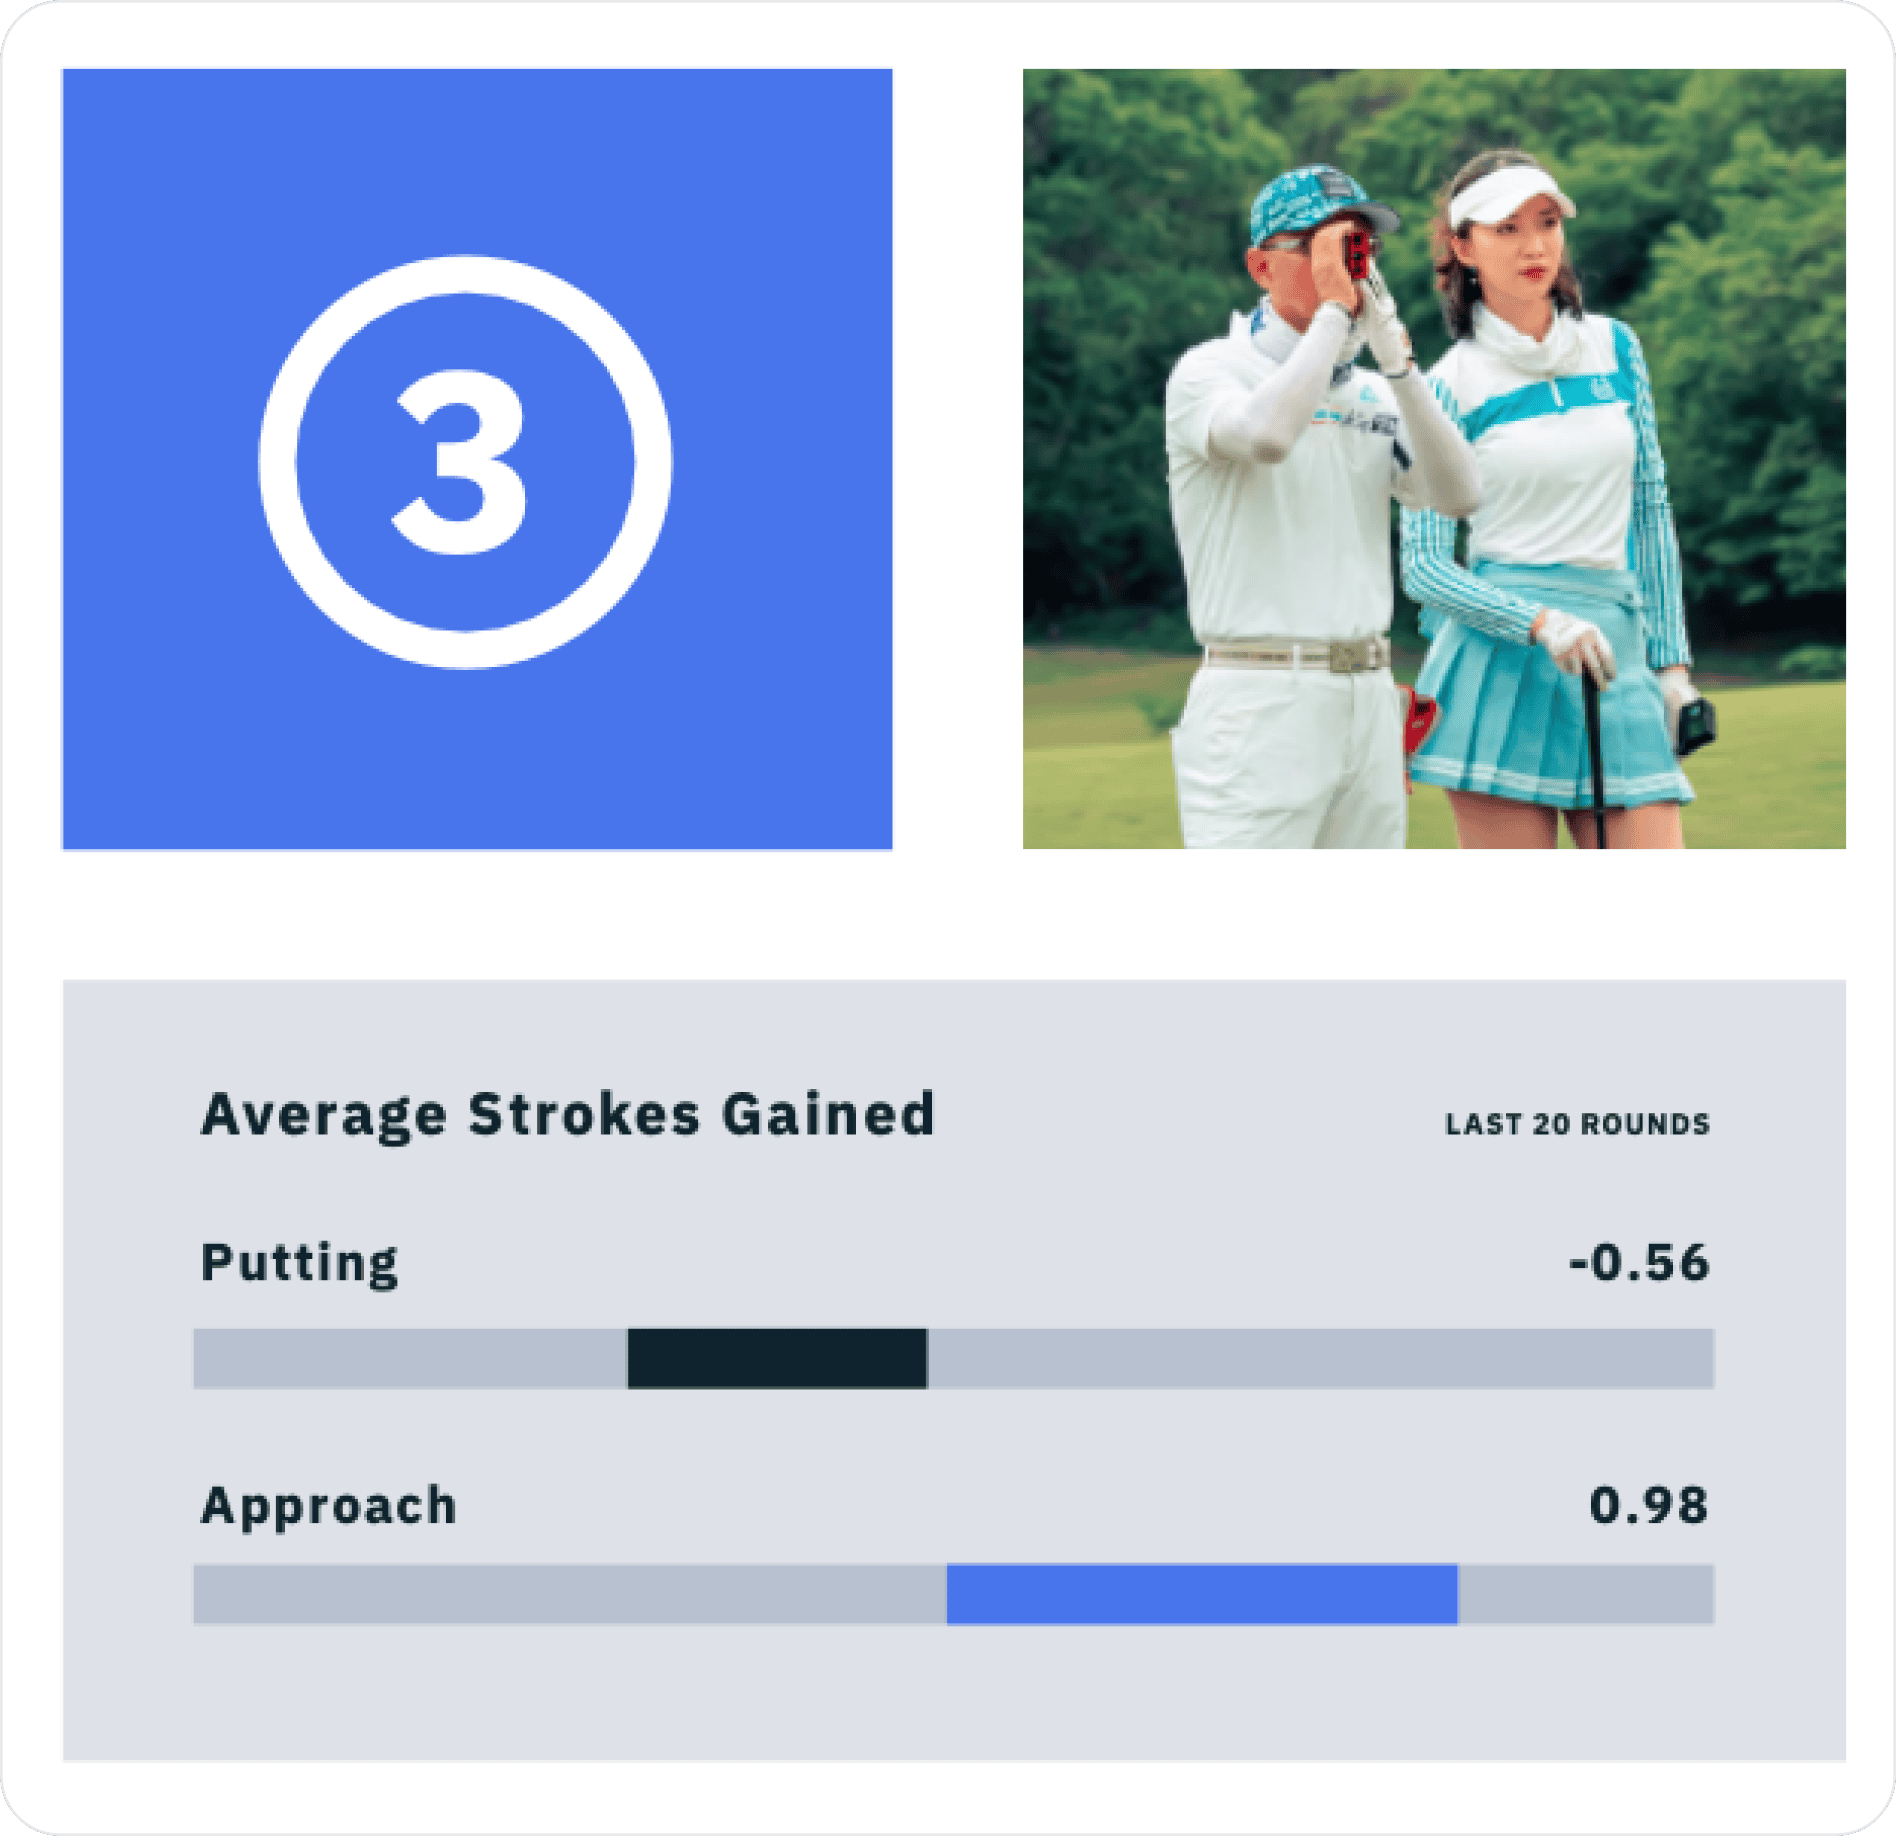
A Game-Changing Dashboard for Golfers
By combining user research, UX strategy, modern UI design, and scalable development, we delivered a seamless, high-performance dashboard that enhances GolfGeek’s core offerings.
